IGNITE8 (I8)
IGNITE8 technology guides leaders through the 8 best practices for driving predictable growth, in an easy-to-use platform.
HARNESS THE POWER OF INTEGRATION
We are doing just that by building a platform that shifts the way companies do business & harnesses, formerly disparate parts, into one easy-to-use killer app that drives predictable growth.
WHAT IS (i8)?
IT IS A STACKED, BUNDLED ENGINE OF GROWTH
Imagine a platform that uses the information gathered through research to isolate the functional and emotional issues impacting customers and delivers Product & Marketing Teams a seamless way to test & validate.
Can you picture shifting from testing right into precise messaging & influence building, using the same audience to boast about what they love and recommend about your brand & service or product-line?
That, alone, would be an attractive offering, but let’s keep going and stimulate continued involvement by ‘incentivizing’ your new advocates.
DESIGNED FOR HUMANS
To create I8, we studied how people interact with business intelligence platforms. We designed our interface to lessen the intimidation commonly felt by non-research, non-technical professionals, while providing slick tools for data analysts.
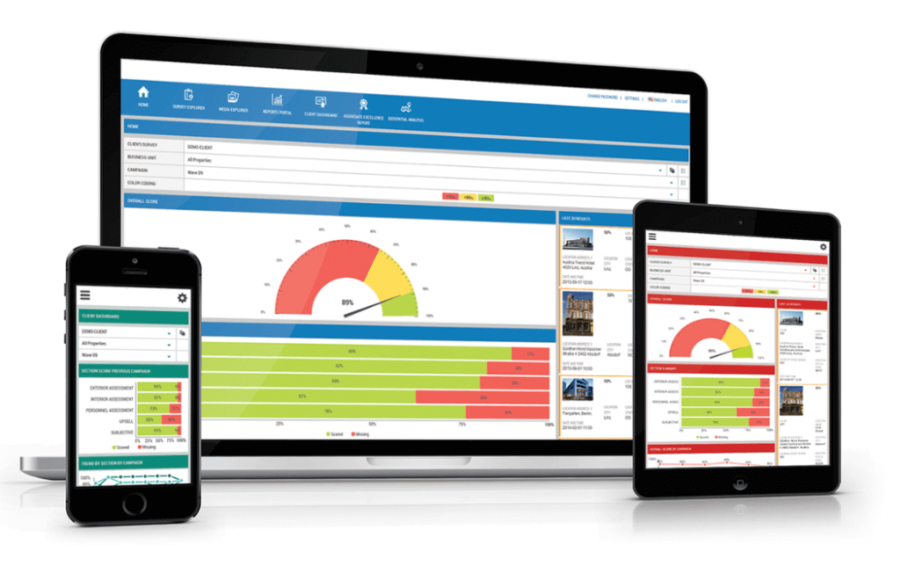
Take a peek at I8’s most popular features
I8’s design and functionality incorporates tactics for users to take action on the results of surveys, mystery shops and customer feedback.
Smart Dashboards
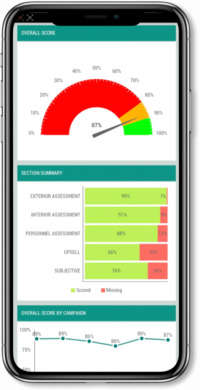
I8’s ability to summarize your data into a rich, informative and colorful dashboard makes it an extremely powerful tool. I8 delivers what you need, when you need it and in a stylized, branded dashboard, understandable across all levels of your organization.
Administration Panel
You have the power from within your site to place a request from our Obsessive Care Pipeline™, add users and/or locations to your portal and a number of other useful functions. Make your request from your portal anytime – our Client Services Team is standing by, ready to help.
Dynamic Drill-Down & Quick-Click Analytics
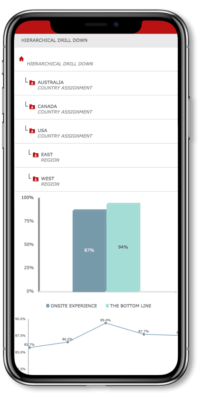
Using I8’s Drill-Down Analytics, clients are able to literally “drill” into their data from the top to bottom while simultaneously filtering their data on a variety of criteria. For example, if your organization is structured by Organization > Division > Region > District > Store, that same organization is reflected in how your data is collected and “rolled-up” through all levels.
Visual Performance Mapping
Like Drill-Down Analytics, Visual Performance Mapping (also known as Geospatial Analysis) grants users the power to dive deeply into their data from a geographic perspective instead of hierarchical one. Program information is displayed on a map, allowing users to dig down into a state, region or specific-areas’ performance data to gain insight into how their organization is performing across the entire geographic span of their locations.
Foundational Reports
I8 comes with a collection of reports called “The Foundational 7.” These reports provide the ability to view measures in a number of different ways, combining time trending with performance by category or behavior and territorial breakouts including zip code, state and country.
Escalations & Notifications
Clients do not have to log into their portal to review their shops – they can receive by email them as soon as they are published. Based on a client’s preferences, results can be automatically sent from I8 at any given time, individually or as a bundle of criteria. Want to receive only shops that fall below a certain score or shops based on a specific answer to a question? I8 can automate your results delivery.
And so many more . . .
Let us give you a behind the scenes tour
Book a demo with one of our CX Specialists today!
